Getting Threat Intel from T-Pot: An Analysis
6 July 2022 | by Xavier Bellekens
If you have had T-Pot installed and running for a few days, you may want to explore the data obtained. Luckily, T-pot comes with Elasticsearch and Kibana pre-installed, making it easy to obtain threat intel.
🍯 Check our article on how to install T-Pot in the cloud in less than 30 minutes.
Kibana tracks the different honeypots activities and alerts. Alternatively, you can manually obtain the individual honeypot logs for analysing unusual activity. But a question remains.
Do you really get value from the information displayed within Kibana?
Kibana
Kibana is a free and open interface that allows you to visualize your Elasticsearch data and navigate the information. In T-pot, that information has already been organized for you, out of the box.
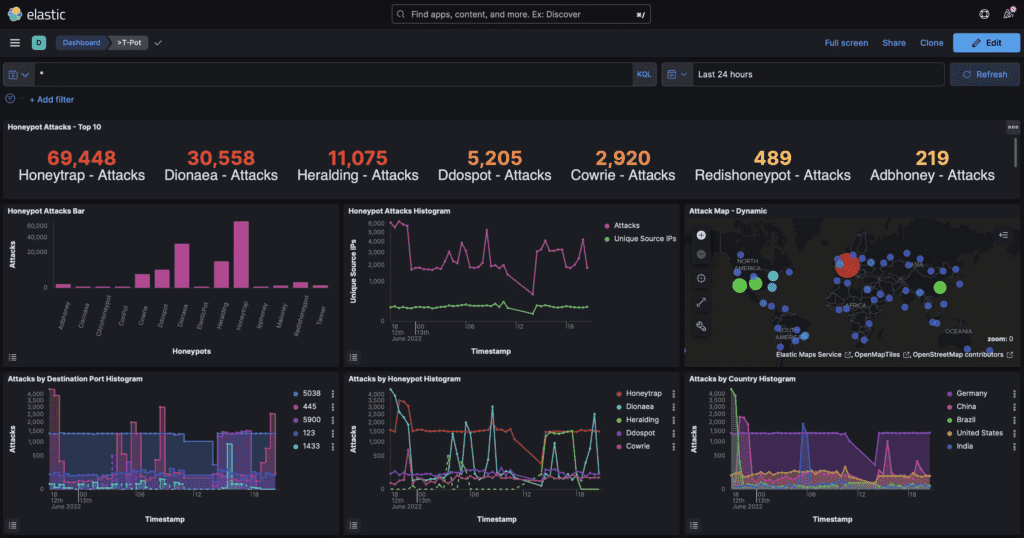
The main interface, provides you with the total number of attacks ingested within a period of time by the various honeypots, an attack histogram, a dynamic map, information about the reputation of the IP and much more.
While this information is carefully displayed and offers data upfront. How, do you, get value from the information provided. In fact, this is a recurrent question over the internet.
I have installed a T-pot Honeypot, now what?
Furthermore, most of the t-pot analysis found on the internet when discussing T-pot is centred around the information displayed within the dashboard. The most common print-screens include
- The cloud of password
- The cloud of usernames
- The count of attacks against each of the honeypots
- Information on the location and countries
- The top 10 source IP addresses (i.e., The ones that have interacted most with the honeypot)
- The attacker IP reputation
Sometimes you also get information about the binaries downloaded on cowrie and some odd behaviours reported. However, the lessons learnt are often limited.
So let’s dig a bit deeper and analyse the data we have obtained running a T-pot instance for the last 10 days.
Known Vs Unknown
One of the key information provided by default with the T-pot analysis dashboard is the proportion of known IP addresses versus all else.
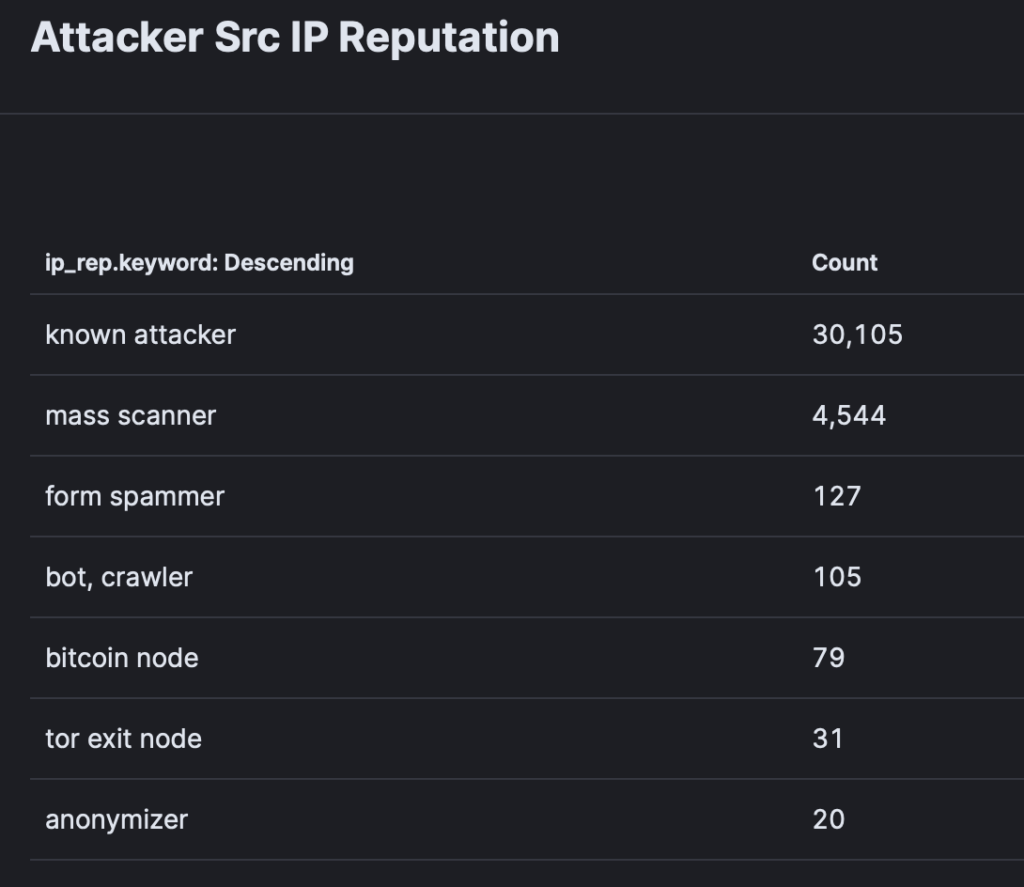
We obtained over 30k interactions from known attackers, only 31 interactions from tor exit nodes and 20 interactions from anonymisers.
Hence, a likely conclusion is that, as an attacker, you are more likely to attract attention when using the TOR network or an anonymiser.
IP Addresses
The dashboard automatically comes with the top 10 IP addresses (i.e., the IP addresses that have had the most interactions with the honeypots). While that information is great, the value of that information is limited.
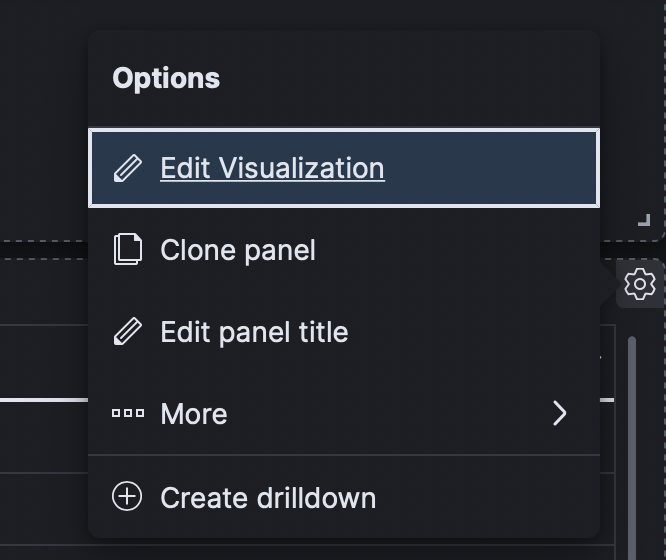
To display more IP addresses, start by editing the dashboard

Then click on edit the visualization
Add extra buckets of information
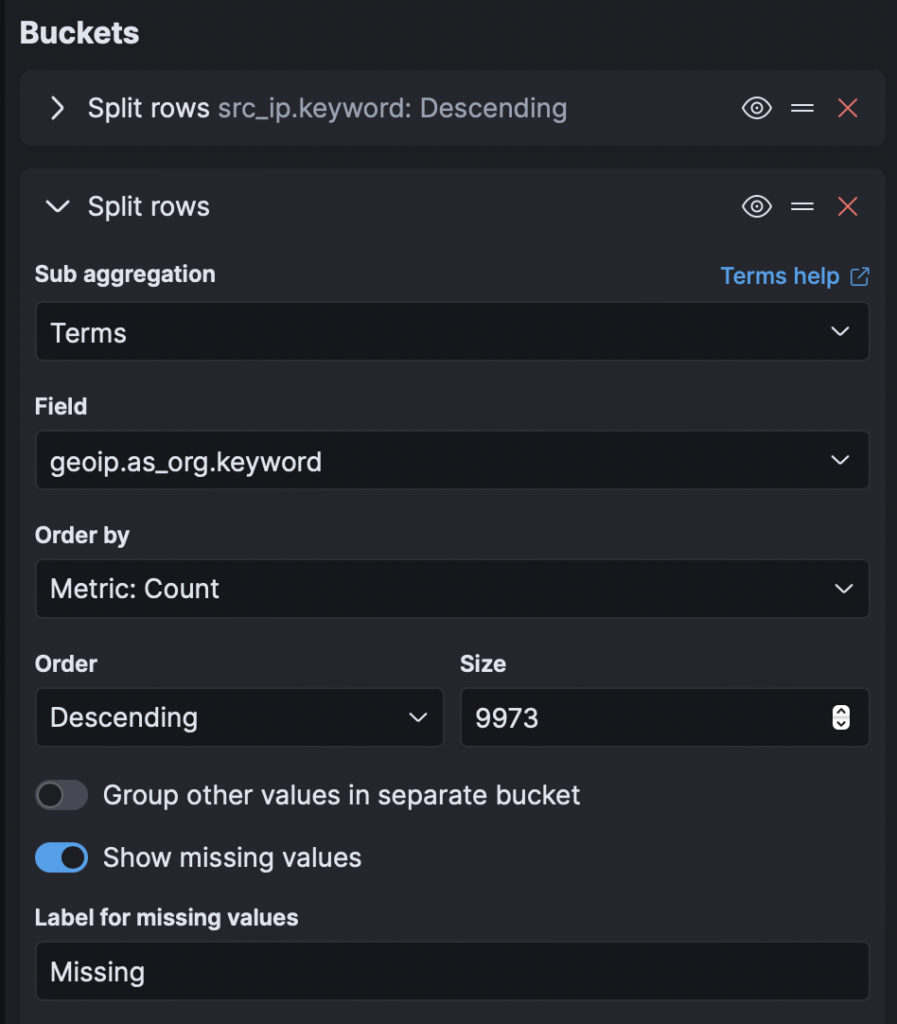
Increase the size to 1000 (that will display 1000 IP addresses) and you may as well add a couple more keywords.
geoip.as_org.keywordgeoip.city_name.keywordip.rep.keywordThese bucket keywords will allow you to have more information about the provenance of the IP address, the ASN associated with the IP address and the reputation of the address.
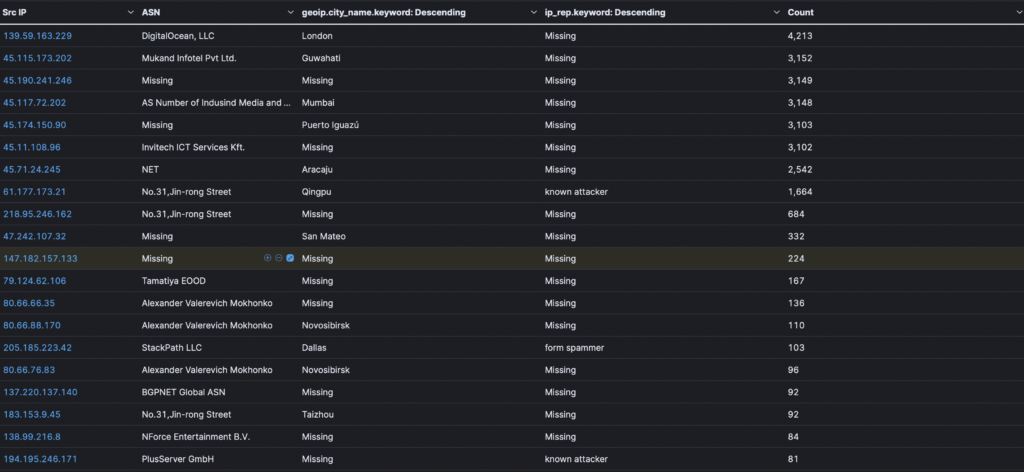
Displaying the organizations, side by side, with the IP addresses allow you to explore the organization that may have been compromise and/or are scanning the internet and have interacted with your honeypots.
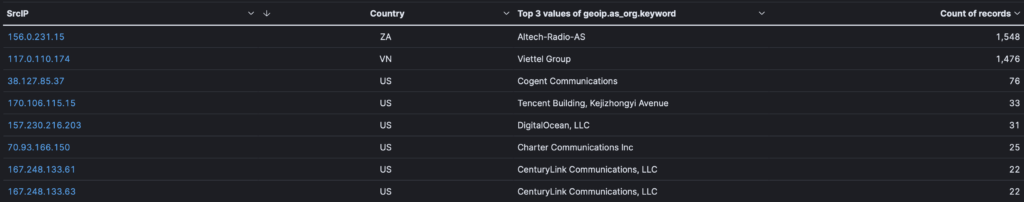
You may also want to create a new bucket, matching the IP with the country of provenance of the attack, helping you understand where attackers are located.
Locating Attackers
As offenders come from all over the world and use a wide range of services, you must be careful in your attribution. That being said, some threat intel can be extracted from the various IP addresses interacting with the honeypots.
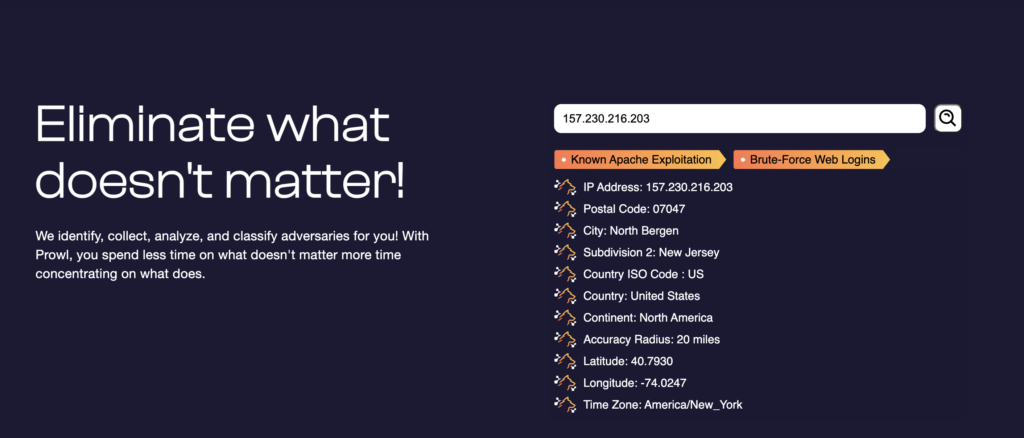
At this stage, you can explore the IP addresses using Prowl. Prowl is a free threat intelligence feed created by our amazing engineering team to get more information on an IP address. Understanding the risk associated with the IP address helps reduce the number of false positive and logs your team has to deal with on a daily basis. It also offers threat intel on the location of adversaries and the attacks they perform.
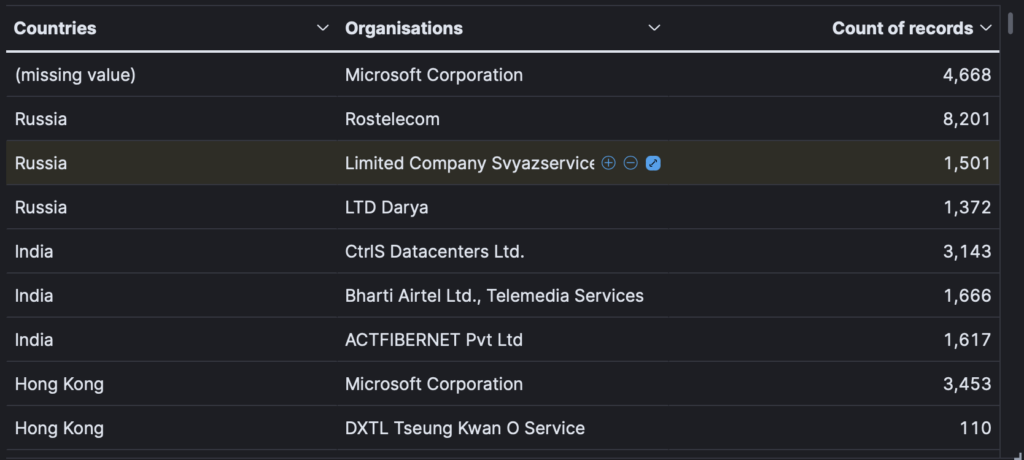
You can also associate the countries with the various ASN and the count of records obtained. As shown, the largest count of records come from Russia and Rostelecom, which is the largest digital provider of Russia.
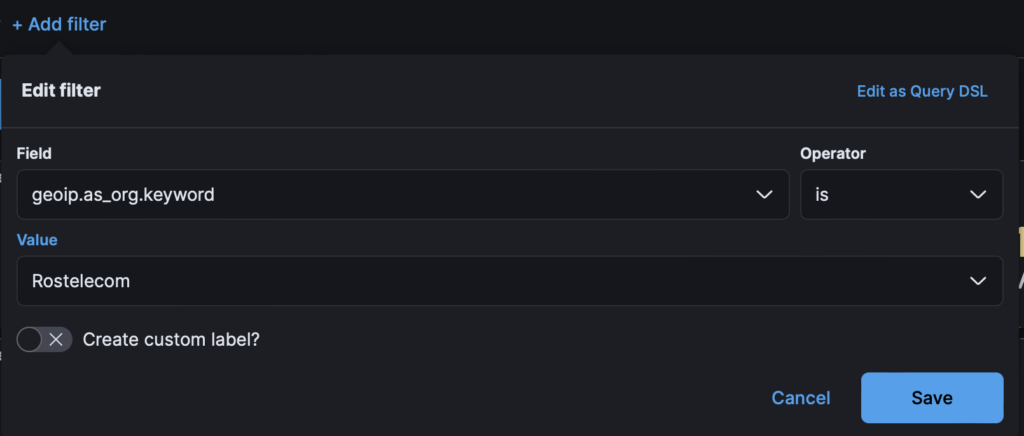
We can filter our results by the provider to obtain threat intel about “Rostelecom” only.
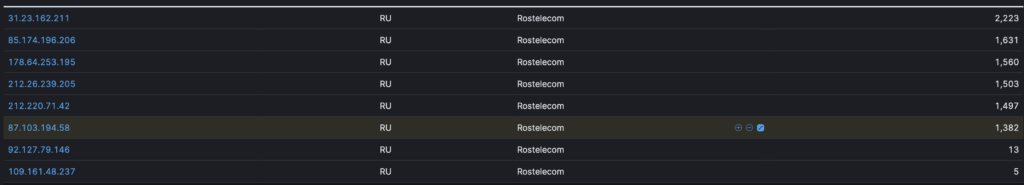
Allowing us to find the IPs from that particular ISP. Using IP2Proxy and Prowl you can verify that these IP addresses aren’t based behind a proxy and therefore help gather information on the threat actor.
Indicators of Compromise
An indicator of compromise (IoC) in the context of computer security is an action that, when seen on a network or on a device, raises the possibility of unauthorized access to the system.
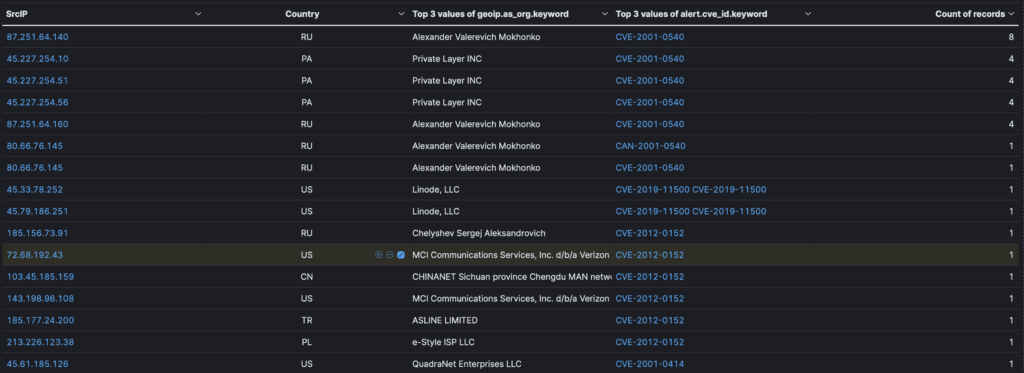
To obtain indicators of attack, we can add another bucket called
alert.cve_id.keyword
This bucket associates IP addresses with the CVE detected by the Suricata intrusion detection system running on T-pot.
The top 3 CVEs include
Suspicious Files Downloads and Uploads
By switching to the cowrie honeypot you can obtain information on the files and scripts that have been uploaded via the SSH/Telnet services.
Our top attacker used a server located in Bolivia. The attacker downloaded a script from another server located in Russia as well as executables from computers based in France, the Netherlands and the UK. The file was always the same.

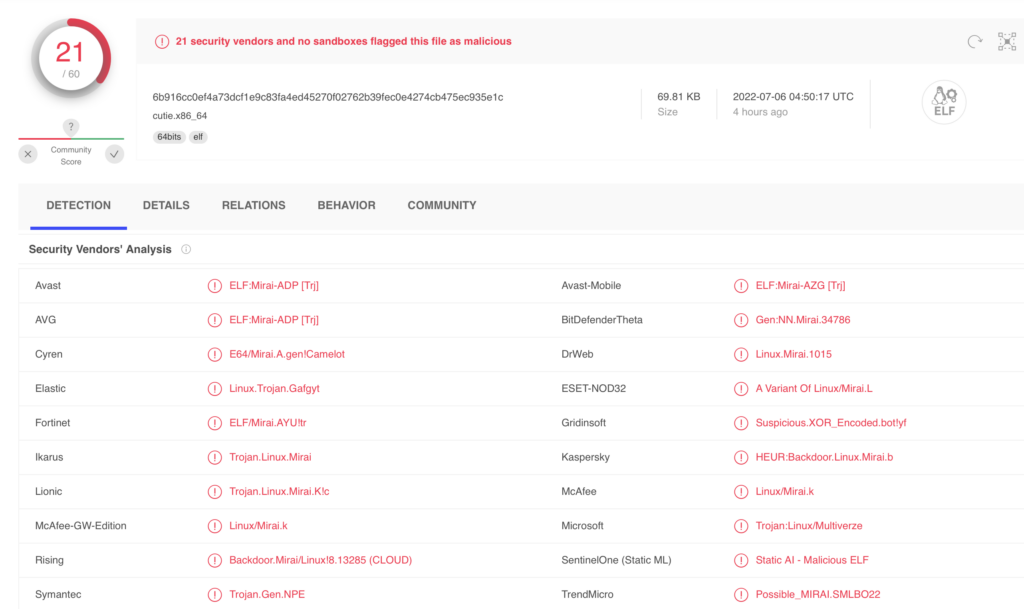
You can further analyse the file or the URL by submitting it to Virustotal.
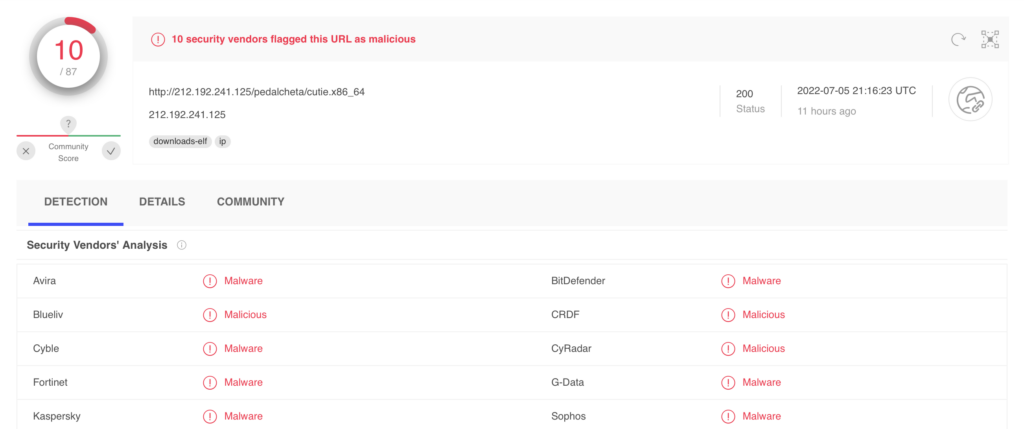
Not only is the URL reported as malicious, the executable is also flagged as the Mirai botnet.
Commands
You can also learn from the recon an attacker performs on the system once obtaining a shell. These are the top commands. Most provide information on the system or test the system to identify it as a honeypot or understand which exploit to launch.
/ip cloud printuname -a cat /proc/cpuinfo echo Hi| cat -nsystemshellcat /proc/mounts; /bin/busyboxNumerous attackers also look for cryptominers
ps | grep '[Mm]iner'ps -ef | grep '[Mm]iner'It is clear that by looking at the commands, most of these are from bots, and therefore may require a more in depth investigation. However, in the event of a human attacker, this information can be helpful to understand their state of mind, objectives and techniques, tactics and procedures.
Summary
T-pot provides a lot of information organized for you in graphs and tables, however, in order to gain value from the honeypot, this information must be analysed, transformed and researched further.
We can clearly see that with a couple of transformation and custom buckets, we can obtain additional insights into the attacks performed. Note that, the transformation and extra visualization created should reflect the use case of your organization (i.e., What IoA, IoC, or information are you trying to get out).
The main insight obtained from our T-pot instance is that the attack patterns between the various offenders is always similar.
- The attacker uses a VPN, a Proxy, or a cloud provider
- The first attack is opportunistic
- If successful, they download new scripts from hacked machines around the world
- Then they deploy malware or crypto ransomware in the hope they spread further.
The main drawbacks of T-pots have been
- The time required for the management of the instance
- The effort required to obtain valuable insights
- The t-pot instance failing over every couple of days
Furthermore, as T-pot isn’t tailored to your infrastructure, it is difficult to get appropriate insights into the mindset of an attacker and detect a cyber-attack attempt early. Our Snare platform allows you to deploy tailored sensors and collect threat intel within minutes.
Tools
Analysing the information provided by T-pot often requires external tools to join the dots. This is a list of tools we would recommand using.
6 July 2022 | by Xavier Bellekens


Speak to an Expert
Whether you have a specific security issue or are looking for more information on our Deception as a Service platform, simply request a call back with one of our security experts, at a time that suits you.